Lethame Capital Notes
Volatility - normalising?
9th May 2020
In a time of extraordinary market events the action in the volatility complex has been extraordinary.
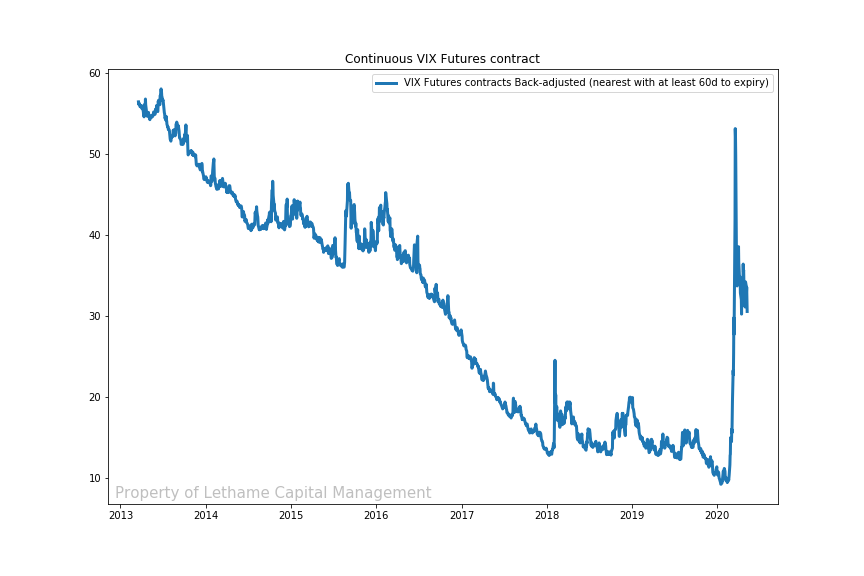
The VIX Index represents the market expectation of 30-day forward-looking volatility of the S&P 500 Index. A VIX futures contracts represents the markets expectation of what level that Index will be on at that particular contract’s expiry date. The top chart 'Continuous VIX Futures contract' shows the ‘back-adjusted’ continuous VIX futures contract. It is desirable to back-adjusted futures contracts because of the price gaps that occur when moving from an expiring contract to the next contract. The back-adjusted price allows the calculation of the profit a holder of the contract would make by holding the contract from the beginning to the end of the time series.

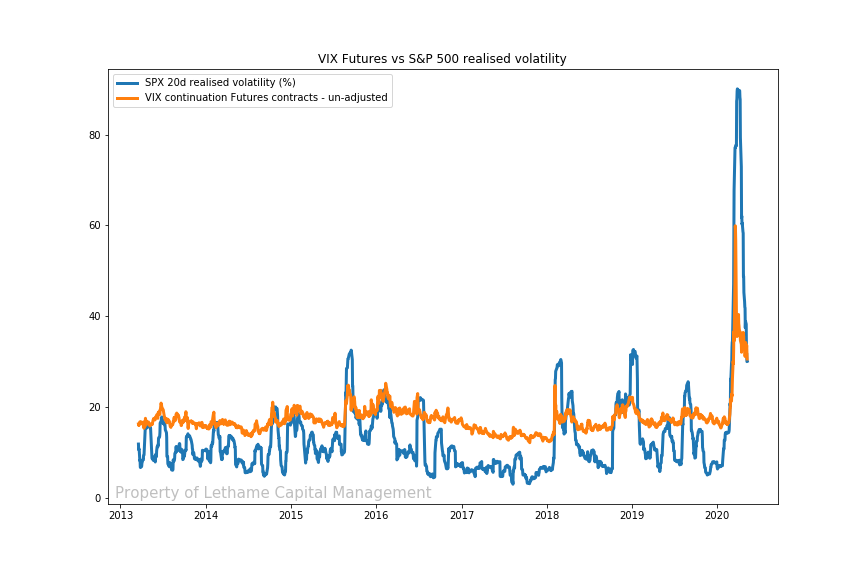
The VIX futures curve normally trades in a condition known as contango. This means that far dated futures trade at a premium to near dated futures. This makes sense as VIX futures are perceived to provide insurance against market falls, volatility and therefore VIX generally rise as markets fall, so ‘buyers’ of VIX futures have a hedge against declining stock prices. Therefore, a premium is demanded by the ‘sellers’ of this insurance to take on that risk. This premium is shown in the following chart 'VIX Futures vs S&P 500 realised volatility' which tracks the realised 20-day volatility of the S&P 500 index against the un-adjusted VIX futures price. It is evident that futures usually imply a higher level of volatility than the index actually experiences (the futures price line is above the realised volatility line). Earning this premium or carry has become an extremely popular investment strategy, including amongst retail investors who have been able to extract it through an effective short position in the VIX futures obtained from one of any number of ETF’s designed to track the performance of VIX futures in some way. Interestingly the first back-adjusted chart which declines consistently from top left to bottom right highlights the profits earned from engaging in this strategy or put another way shows the insurance premium paid to own VIX futures protection.

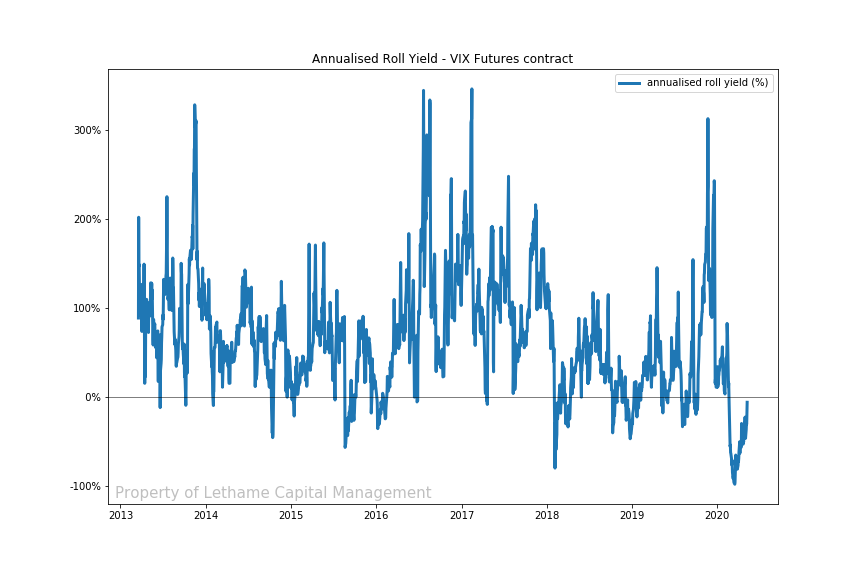
Unfortunately, there is a catch. This premium in long dated futures is highlighted in the final chart, 'Annalised Roll Yield - VIX Futures Contract'. The VIX futures, in the area of the curve we concentrate on, are in contango more than 80% of the time. The selloff in risk assets that began in late February caused the VIX futures curve to enter backwardation, the curve flips and it is near dated futures that trade at a premium to far dated. In this case the backwardation occurred because May dated futures rallied substantially more than June and so on. This process is usually because the market’s expectation is that high volatility in the near term will dissipate and volatility will be lower in the long term.
Our back-adjusted futures price chart which at the time represented the May VIX futures contract rallied from a low of around 9.5 in mid-February to a high of 53.5 on 18th March, the future increased greater than 5x on a closing basis. Many years of carry profits disappeared in just a few days. The VIX index itself hit a closing high of 82.69 two days earlier which was higher than the highest close of the financial crisis of 2008/9.
The reason for this extreme movement was in part the extraordinary volatility being realised in the markets themselves. During May equity indices saw three consecutive daily price movements of greater than 9% for the first time since 1929. We can see in the 'VIX Futures vs S&P 500 realised volatility' that realised volatility substantially exceeded that implied by the VIX future and in fact equities exhibited higher realised volatility than at any time since the 1987 stock market crash.

The authorities have taken unprecedented measures to support the financial system. Friday marked the day that the VIX Index finally closed below the psychologically important 30 level. It is perhaps no coincidence that the curve has returned to its normal contango condition and realised volatility is once again below implied. Whilst not back to ‘normal’ financial markets are considerably less fearful about what lies ahead.