Lethame Capital Notes
Observations from an unusual sell off
13th June 2020
For an investor the process of bearing risk has some similarities to the economic exposure of an insurer. In return for carrying the risk that other investors do not want to hold, the investor anticipates receiving a premium – for example a value investor expects to earn the value premium over time and is prepared to bear the risk of a sell-off in stocks generally in order to earn this premium.
The payoff profile one would expect from receiving premium to underwrite risk is concave and the distribution is often described as being negatively skewed. In other words the investor expects to collect a small premium over time but is exposed to potentially large losses. More technically speaking concave/negatively skewed payoff profiles of this nature are often thought of as being short volatility. Most investment strategies fit into this category.
On the other hand, strategies which incorporate trend following or its close cousin momentum have return distributions with very attractive properties. Whereas concave strategies can be thought of as collecting an expected return premium for bearing risk, a convex payoff can be thought of as expecting to pay an insurance premium in return for reducing risk exposure. They are what is described as positively skewed which is a way of saying they suffer many small losses but with the occasional large payoff. This implies that while concave strategies benefit from calm market conditions, convex payoffs benefit from turbulence.
Interestingly, in an efficient market when we pay a premium to hedge a risk our expectation would normally be negative. We do not expect to make a profit on the insurance we buy against our house burning down. In terms of the trend or momentum strategy however, there is significant academic evidence¹ going back as far as 200 years in some cases² which documents that those paying the insurance premium in trend following terms have a positive expectation. Fama and French³ even stated "The premier anomaly is momentum”.
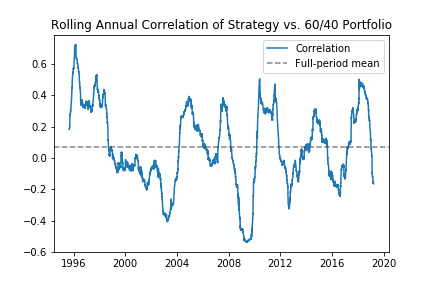
These characteristics have been documented to manifest themselves in a return

of bonds of very close to zero. In fact, it appears that the convexity of the strategy offers ‘good’ diversification. A ‘bad’ diversification will help in bad times, but that will also destroy performance in good times…for example systematically buying put options. A ‘good’ diversification…will help in good times without compromising long-run performance. This can only be achieved with a strategy that offers a time varying beta: a positive beta in good times and a negative beta in bad times. Research suggests that this is what is achieved with trend following, the convex profile of which has been likened to an option straddle⁴.
It is this combination that makes the strategy such an interesting addition to a portfolio of risk assets.
The remarkable US treasury bond
These attractive properties have possibly not been as interesting to investors as they might be in recent decades as investors have not needed to look far to find a fantastic diversifying asset. Since the US came off the gold standard in 70’s U.S. Treasuries have provided both a positive expected return and an insurance benefit. During the 15 worst US equity drawdowns since 1971 the average US equity return was -20.8% compared to an average +6.2% return over the same period for the US Treasury.

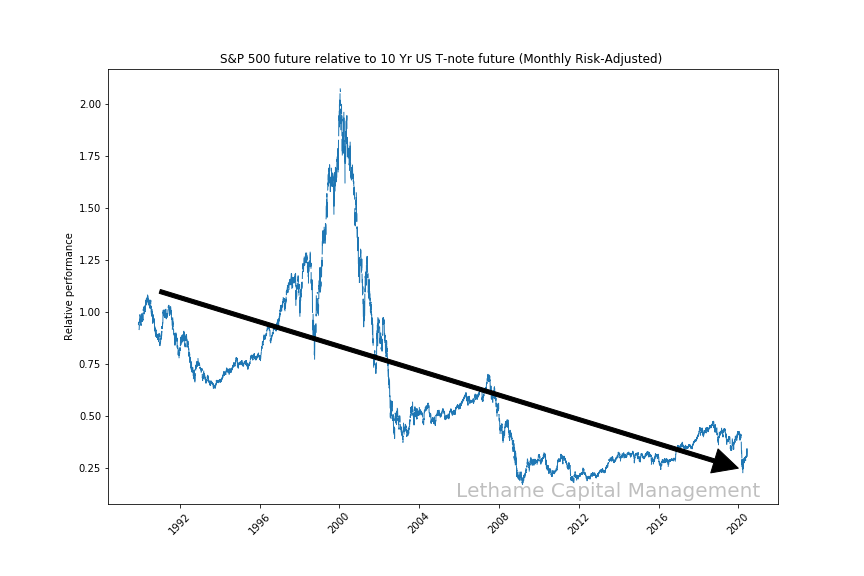
A closer look shows that this performance is all the more incredible considering that in that period since 1971 U.S. equities have seen a greater than 75% drawdown against a monthly risk-adjusted benchmark of 10-year treasuries. The result is similar in the period shown in the chart in which we have futures data. This superior risk adjusted return is unexpected in an efficient market and has allowed some “highly successful asset gathering strategies”. With the obvious exception of the dot com bubble era, it implies monetary policy was consistently set too tight and that over the last 40 years a disproportionate share of global income has been transferred as rent from debtors to creditors.
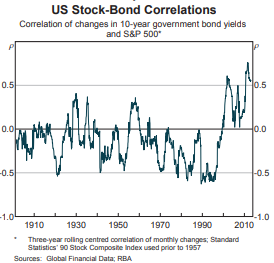
Capitalising on this asset has therefore become the core building block of investment strategies which are very reliant on its recent historic relationship with equities continuing in order to provide investors with an attractive risk adjusted return. It should be remembered that while recent history does indeed suggest a negative correlation and so a diversified portfolio the evidence of the last 100 years is that the two assets are positively correlated (i.e. equity prices and bond yields are negatively correlated as per the following chart) most of the time.

Can it continue?
Central bank policy has now taken interest rates to zero and market participants are being conditioned to expect them to stay there for quite some time. It seems unlikely therefore that the superior risk adjusted returns provided by these government bonds is repeatable in the longer term. This should have significant implications for policy portfolios.
It was therefore very interesting to observe the difficulties these two assets had in the first quarter. In the period 6th– 18th March as equities fell 12%, the 10-year treasury future also fell 3.7%. On a starting month volatility adjusted basis this was equivalent to a 14% fall in a leveraged treasury position. There have been a lot of explanations for this including liquidation from “highly successful asset gathering strategies”.
We suspect that this period may well be a taste of things to come and investors may need to reassess how they achieve their diversification. Those attractive characteristics that a trend following strategy can provide may mean exposure to this type of diversification may well become a lot more attractive in the future.
¹ Research concludes that future returns are positively correlated with those returns assets have experienced in the recent past (Jegadeesh and Titman, 1993, 2001, Asness, 1994, Conrad and Kaul, 1998, Lee and Swaminathan, 2000, and Gutierrez and Kelley, 2008). This finding applies across both different asset classes and countries (Rouwenhorst, 1998, Griffin et al., 2003, Israel and Moskowitz, 2012, and Asness et al., 2013). Specific academic research into the subject of trend following and momentum investing: Cutler et al. (1991), Silber (1994), Fung and Hsieh (1997, 2001), Erb and Harvey (2006), Moskowitz et al. (2012), Menkhoff et al. (2012), Baltas and Kosowski (2013), Hurst et al. (2013), Baltas and Kosowski (2015), Levine and Pedersen (2016), Georgopoulou and Wang (2017), Hurst et al. (2017), Lempérière et al. (2014), Ehsani and Linnainmaa (2019), Garg et al. (2019), Gupta and Kelly (2019), and Babu et al. (2020a,b).
² Lempérière, Y., Deremble, C., Seager, P., and Potters M.J-P., (2014) “Two Centuries of Trend Following” – Journal of Investment Strategies.
³ Fama, E. and K. French (2008) “Dissecting Anomalies” - The Journal of Finance.
⁴ Fung, W., and D. A. Hsieh, 2001, “The Risk in Hedge Fund Strategies: Theory and Evidence from Trend Followers”, Review of Financial Studies.